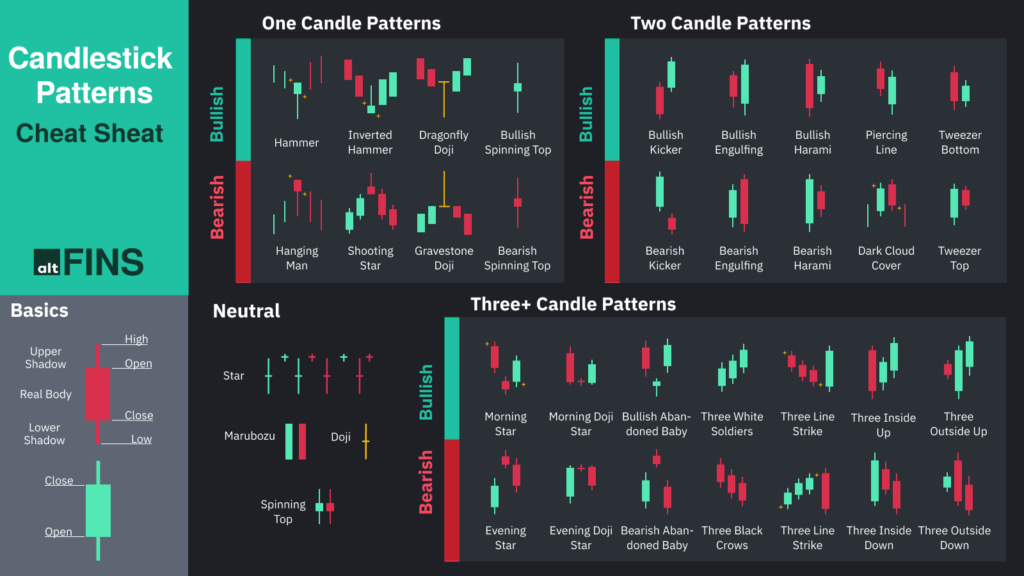
Technical analysis is a cornerstone of successful cryptocurrency trading, and understanding chart patterns is crucial for making informed trading decisions. At Coin Trade Academy, we’ve developed a comprehensive approach to teaching these essential patterns that can help you identify potential trading opportunities.
Chart patterns are visual representations of market psychology and can provide valuable insights into potential price movements. The most reliable patterns typically fall into two categories: continuation patterns and reversal patterns. Understanding the difference is crucial for developing your trading strategy.
One of the most recognizable patterns is the Head and Shoulders pattern, which often signals a trend reversal. This pattern consists of three peaks, with the middle peak (head) being higher than the two surrounding peaks (shoulders). When trading crypto, this pattern can be particularly powerful when combined with volume analysis. We teach our students to look for increasing volume on the left shoulder and head, with decreasing volume on the right shoulder as a confirmation signal.
Double tops and double bottoms are other important reversal patterns. These patterns form when price tests a level twice without breaking through, suggesting that the current trend may be losing momentum. In cryptocurrency markets, these patterns can be especially significant due to the market’s high volatility and the psychological importance of round numbers in pricing.
Triangle patterns – including ascending, descending, and symmetrical triangles – are common continuation patterns in crypto markets. These patterns form as price consolidates between converging trendlines. The key to trading these patterns successfully lies in understanding volume characteristics and waiting for a decisive breakout before entering a position.
Flag and pennant patterns are shorter-term continuation patterns that often appear during strong trends. These patterns represent brief pauses in the trend and can provide excellent entry points for traders. However, in crypto markets, it’s essential to consider the overall market context and sentiment when trading these patterns.
The importance of volume cannot be overstated when analyzing chart patterns. Volume serves as a confirmation tool and can help validate pattern formation and breakouts. We teach our students to always consider volume as part of their pattern analysis strategy.
False breakouts are common in cryptocurrency markets, so we emphasize the importance of confirmation and proper risk management. Using multiple timeframe analysis can help validate patterns and reduce the risk of false signals.
At Coin Trade Academy, we provide practical exercises and real-market examples to help students identify and trade these patterns effectively. Remember, pattern recognition is a skill that improves with practice and experience.

